The internet allowed marketers to, finally, quantitatively measure all their activities. Marketers can now stop guessing whether their campaign was successful or not. If you want to practice effective digital marketing, this one’s for you.
Before, the closest way to measure if what they were doing was effective or not was only through correlation. Take, for example, a clothing retail company. They executed a new campaign that includes ads on, say, both TV and billboard, then they waited. After a few weeks, their sales increased. Hmm.
Was it an effective campaign?
Maybe. We’ll never know for sure.
But that was before. Now, you can measure and track literally everything.
I read an article before that Facebook and Google were tracking eye movements from their users to determine where to place their ads more effectively (creepy huh?).
Figuring out what to measure and where to start is a problem in of itself, but that’s not what this article is about. This article focuses on what you should do with those data to drive your business decisions.
Of course, the assumption here is that you already have an analytics software installed on your website (you do have it, right? I have always been a fan of Google Analytics primarily because it’s free and answers my needs).
3 Methods to Use Data to Achieve Results
Set Up Goals on Your Website
Goals can be “hard goals” or “soft goals.” Hard goals are revenue targets, number of leads generated. They have a direct impact on the business. Soft goals are those proxies we use to determine what success looks like. Some of these are engagement, playing a video, downloading a PDF, etc.
Setting this up differs for every company and industry.
I follow a framework when I start any digital marketing effort. It is called the Digital Marketing and Measurement Model. It has five basic steps. It sounds very simple, yet I found that many marketers are fond of vanity metrics that doesn’t contribute to the business’ bottom line. Here are the five steps from Avinash Kaushik:
- Identify the business objectives
- Identify goals for each objective
- Identify the key performance indicators (KPI)
- Identify the targets for each KPI
- Identify valuable segments for analysis Learn the basics.
Apply it to your company right now, then present it to your boss. I’m pretty sure she’ll be impressed. This should drive your marketing campaigns. Once you set this up properly, everything you do will be aligned. You’re guaranteed that everything you do moving forward should only contribute towards achieving the goals and objectives.
A/B Test or Optimize Everything
I recently came from a roundtable discussion facilitated by eConsultancy. A phrase that stuck with me was “moving from I think to I know.” The easiest way to do this is to perform A/B Tests across all your marketing activities.
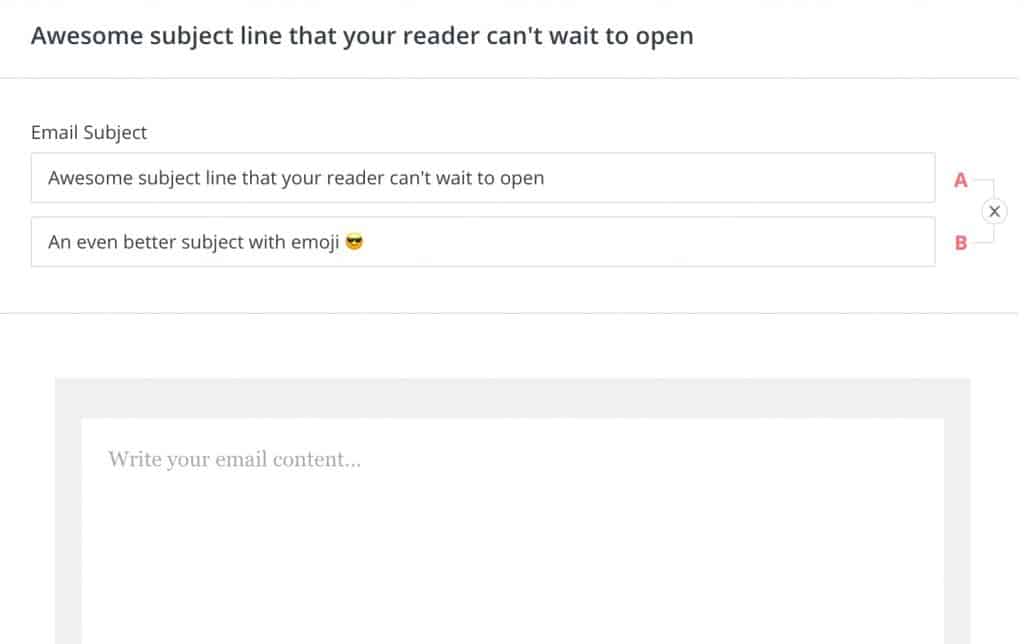
You are using email to send out newsletters or updates to your leads, right? One of the best email marketing software out in the market today is ConvertKit. It allows you to A/B test your subject lines.

If you want to A/B test content on your website, use Google Optimize.
You need two other elements to do this: (1) a goal that will determine the winner, and (2) another variation of the content. Of course, this goes without saying that you need the original page as well.
Then, for the A/B test to work, you need to have another variation of the page you are testing. It should be live and public as well. For example the URL of the original content is …/original-page/ then the variation is …/variation-page/.
Segment Your Data
One of the most common mistake I see is not segmenting your data. Before I read Avinash’s blog, I was also a victim of this. No school or certification that I know of teaches this.
The reason why this is important is not everyone who visits your site is valuable to you. Cutting the long story short, your customers are more valuable than people who are just planning to buy from you (aka potential customers). The people who are planning to buy from you are also more valuable than those who accidentally came by your site.
In analytics, you do this by looking at the different groups who visit your site. Use segments to place your traffic into buckets. For example, During your DMMM, you identified that Goal 1 is triggered by people who requested a free product demonstration. You determined that they are high-value leads. So, looking only at their behavior on your website will provide you more insight than the entire blob of data.
Here’s how it might work in real-life. The segment who requested for a free product demonstration all came from social media traffic. Drilling further, you found out it was from the post you published on LinkedIn. You also found out that, on average, they looked at 4 pages on your site. The last page, where they all converted was the About Us page. Usually, this behavior is different from “all” traffic. It does not give you that level of insight.
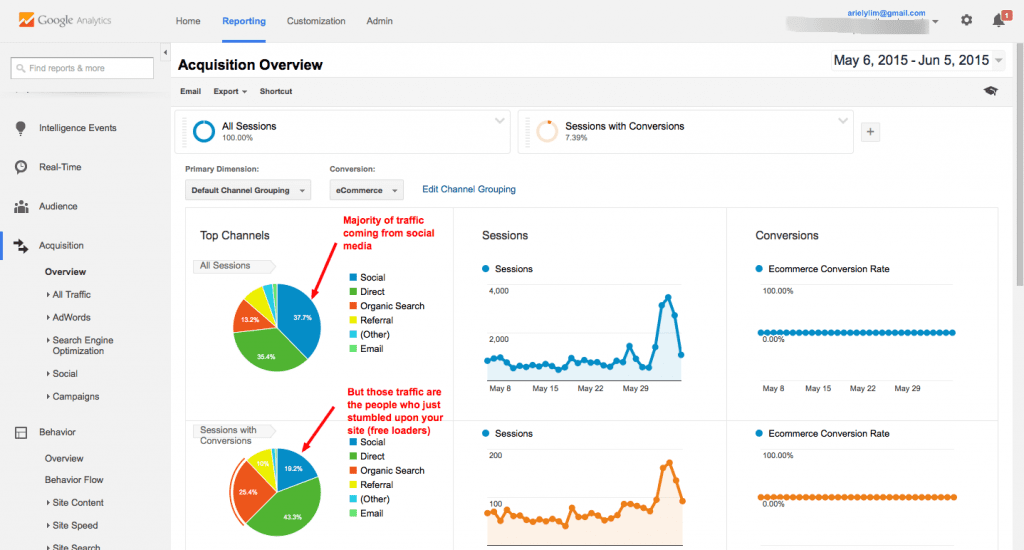
Here is another example. If you look at the image below, you will see that majority of the traffic comes from social media (if you don’t look into segments). However, some marketers already stop at this level.
What you will now think is that social media is the best driver of traffic for your company. However, if you look at the sessions with conversions (i.e. the visits that matter more), then you will see that social media is actually one of the lowest sources of these important visits.
So if you did not drill down further and assumed that Social is where you should spend your money, then you’d be wasting money there.
Marketers can now stop guessing and move from “I think to I know.” With all these free tools available, there is no excuse not to use them to your advantage.
Have something to add? Let me know in the comments section below.
