Google Analytics (GA) is a very powerful analytics tool that can help you grow your business. It allows you to track your website traffic, as well as integrate with eCommerce purchases. GA allows you to analyze your users’ interaction on your website, tell you which pages are driving traffic, and let you see which channels are generating more conversions and revenues for your business.
Unfortunately, a lot of Google Analytics accounts aren’t configured properly. This results to bad data. And using bad data in your analysis can have negative consequences.
But don’t take my word for it. Data scientists all face this problem and it’s always the first thing they tackle—making sure the data you’re using is accurate.
So, let’s make sure the inputs you get from Google Analytics are accurate.
Start by logging in to your Google Analytics account. Then head on over to the admin section of your account.
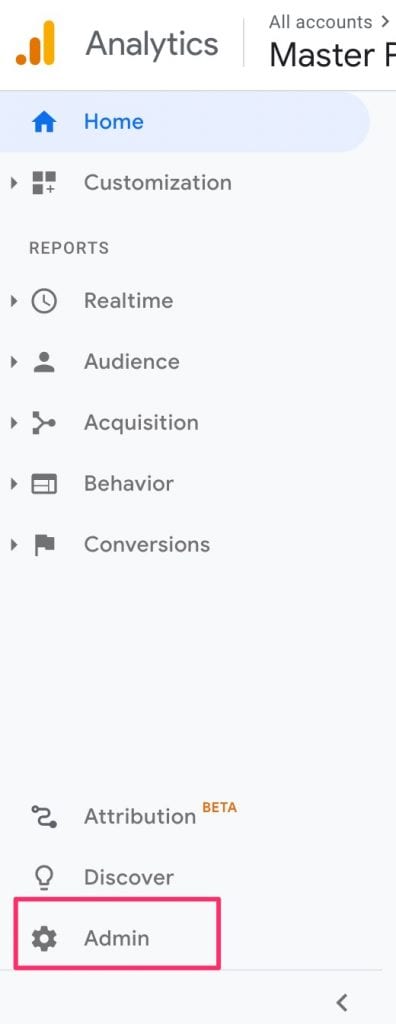
PS: If you don’t have a GA account, you can learn how to create and install Google Analytics on your website here.
Preparatory Points
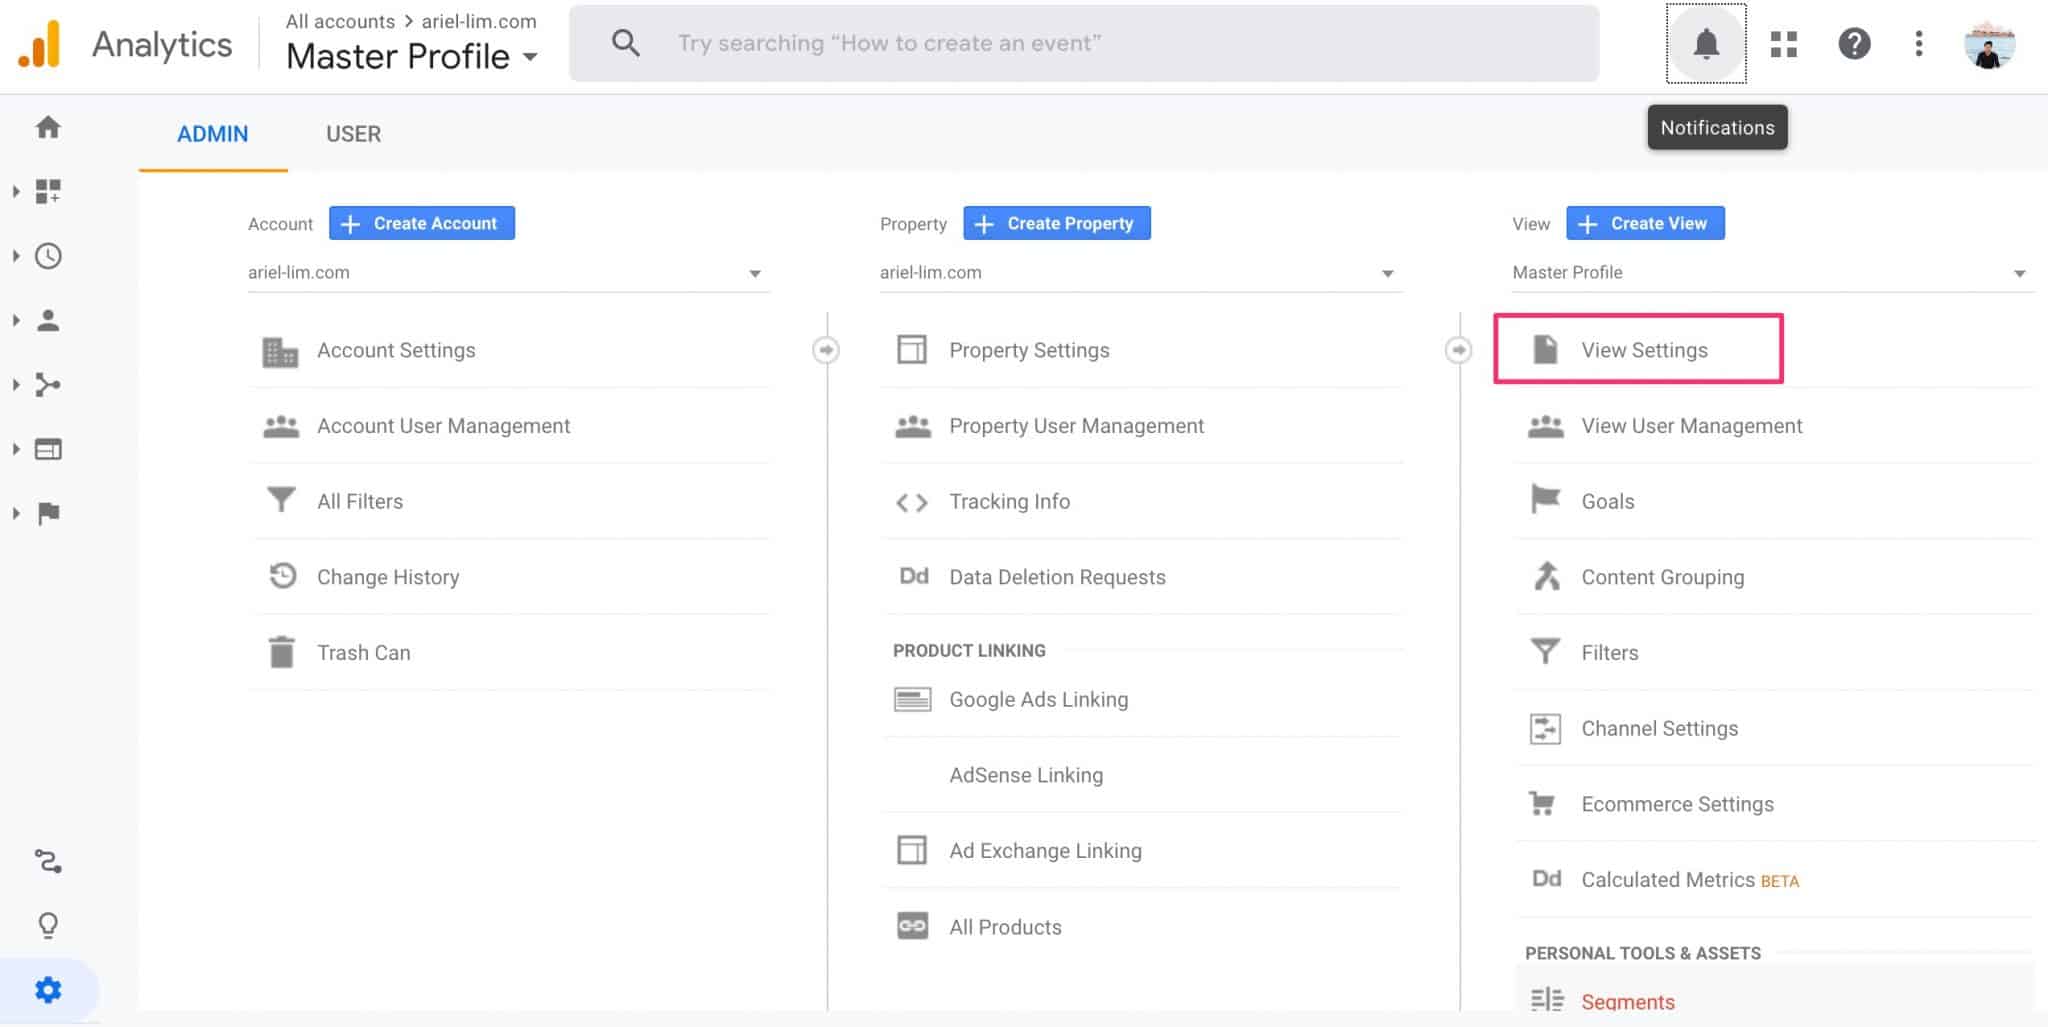
Once you get to the admin section, you will see a screen with three columns. Here’s a quick overview starting from the left:
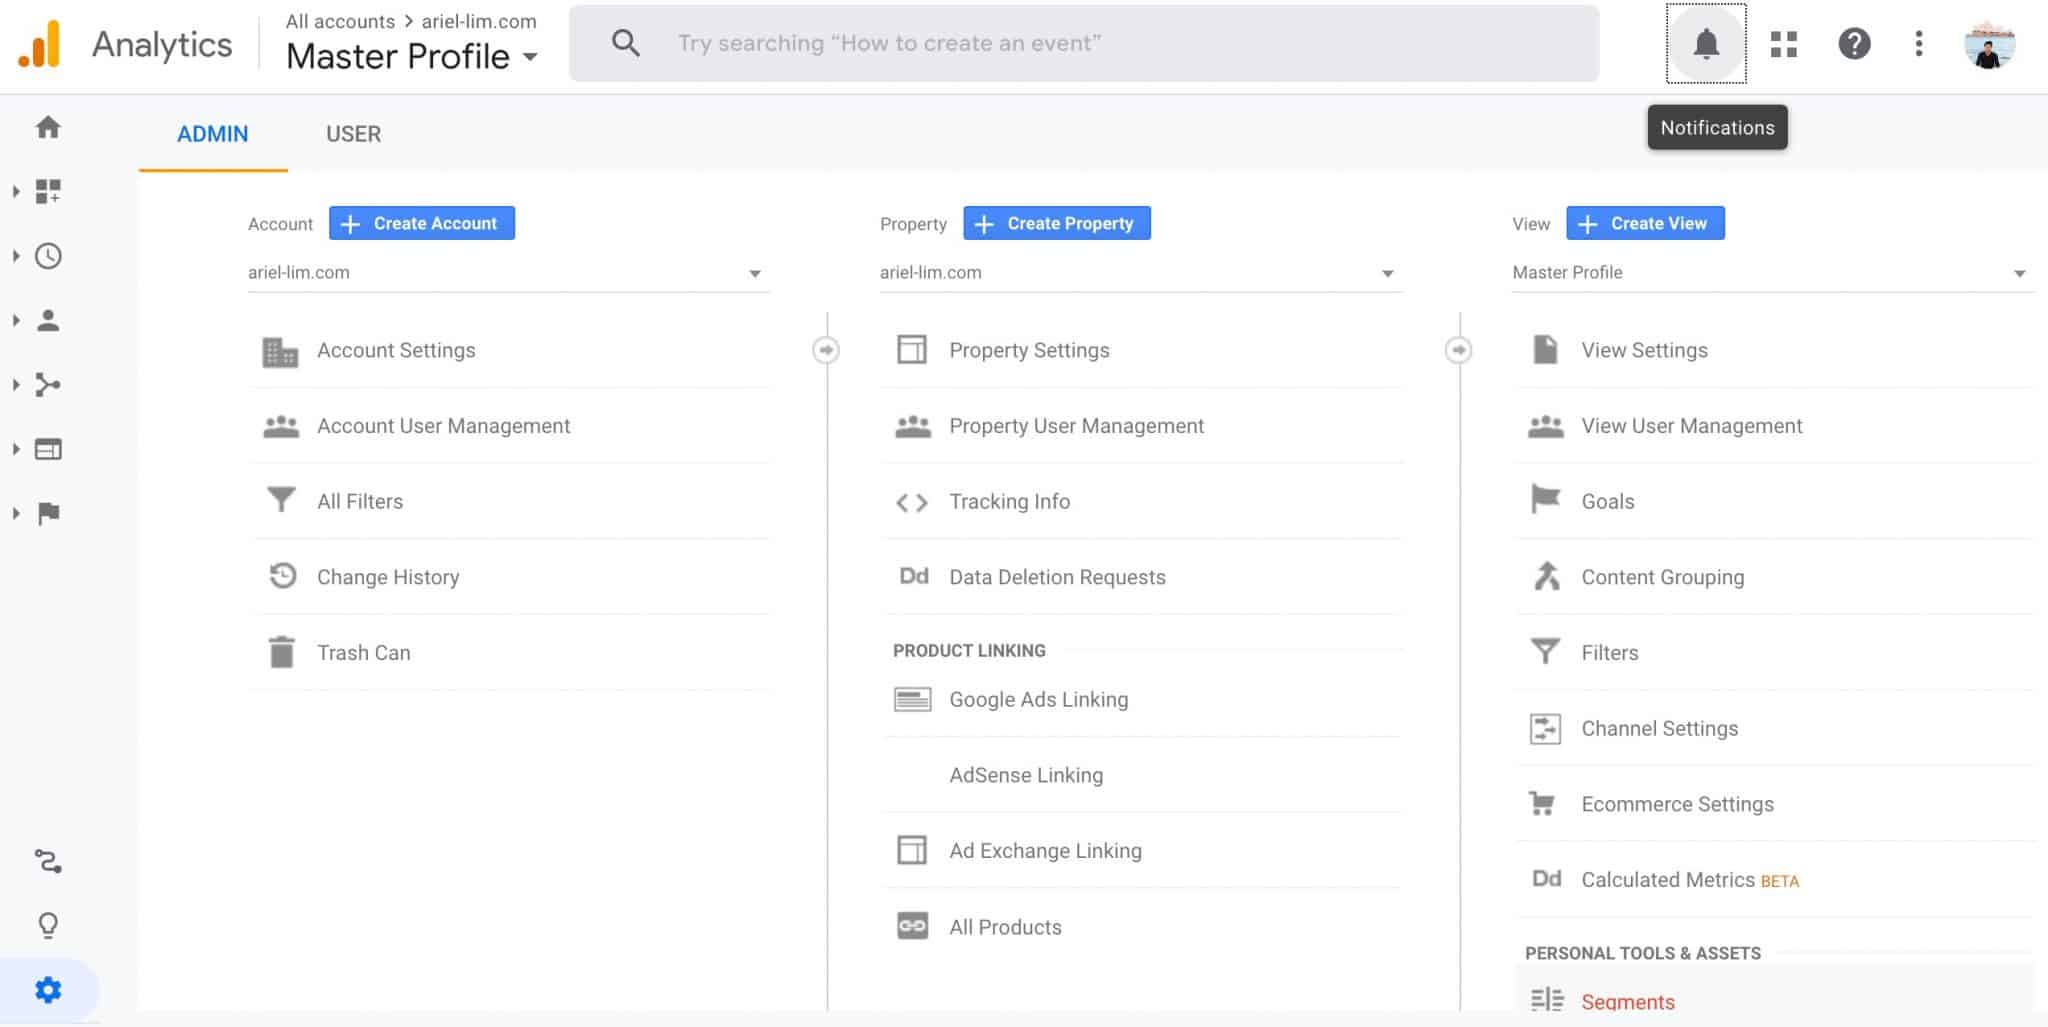
- Account —> this section handles the settings for your entire account. Usually, that’s associated with your email.
- Property —> this is where you’ll find the different online properties that you want to track (website and/or apps). E.g. in a single account, you can have multiple websites.
- Views —> this area controls the settings of a particular property. E.g. in one website (property), you can have multiple views.
Here’s how it looks like to help you understand how the three work together.
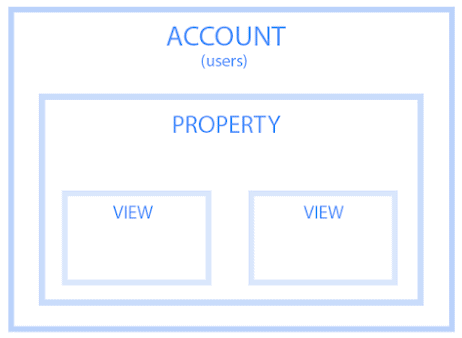
You can learn more about this hierarchy from Google Analytics.
Basic Google Analytics Settings Every Website Must Have/Follow
1. Create 3 Views or Profiles
The first thing you’d want to do is create multiple views. Google Analytics creates only one when you create an account. This will be named All Web Site Data by default.
Since I’m demonstrating from my account, you will see that I changed the name to something else which I explained further below.
The main reason you create three views is two-fold:
- Prevent you from using inaccurate data in your reports
- Capture all data just in case something happens
Let me elaborate on that.
Why Creating Multiple Views in Google Analytics Is Important
When you visit your own website, that is recorded in Google Analytics. If you keep on visiting your site multiple times a day, all those are recorded too. If anyone else in your business do that, they are also recorded in GA.
This naturally skews your data. It won’t reflect how actual users are behaving.
If you add some filters or special configurations (which we’ll get to below), the view which you applied those settings will be irreversible. Meaning, if you accidentally filter out your own traffic, nothing will get recorded in that view.
That said, if you only have one view in your GA account and add these filters/change their settings, you risk losing valuable data. On the other hand, if you don’t add these configurations, you might end up with bad data.
The solution? Create multiple views.
The end goal is to have at least these 3 views in your property. Here’s how it looks like on my own GA account:
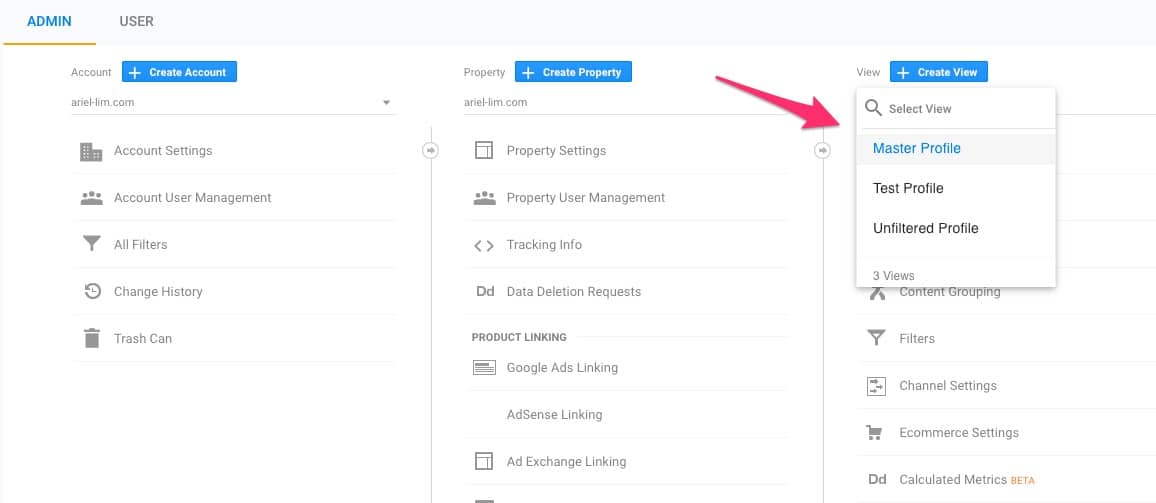
- Unfiltered —> This is the original view that Google Analytics created. No filters, no special configurations. All data is recorded here. By default, it’s called All Web Site Data. I used to called this the Raw View.
- Test —> As the name suggests, this is a view where you apply initial configurations to test if they are working properly or not. If whatever you did is working properly, that’s when you apply it to the next view.
- Master —> This is the main view where you make your decisions and analysis. Because you tested the configurations in the test view and not here, you are guaranteed that all data here are accurate.
You can use your own naming convention, of course. For example, you can leave the All Website Data view instead of renaming it to Unfiltered. Just make sure it’s meaningful and easily understood. Using View 1, View 2, etc. is a terrible idea.
Step 1: Click the view settings in the default view
To get started, click on View Settings.
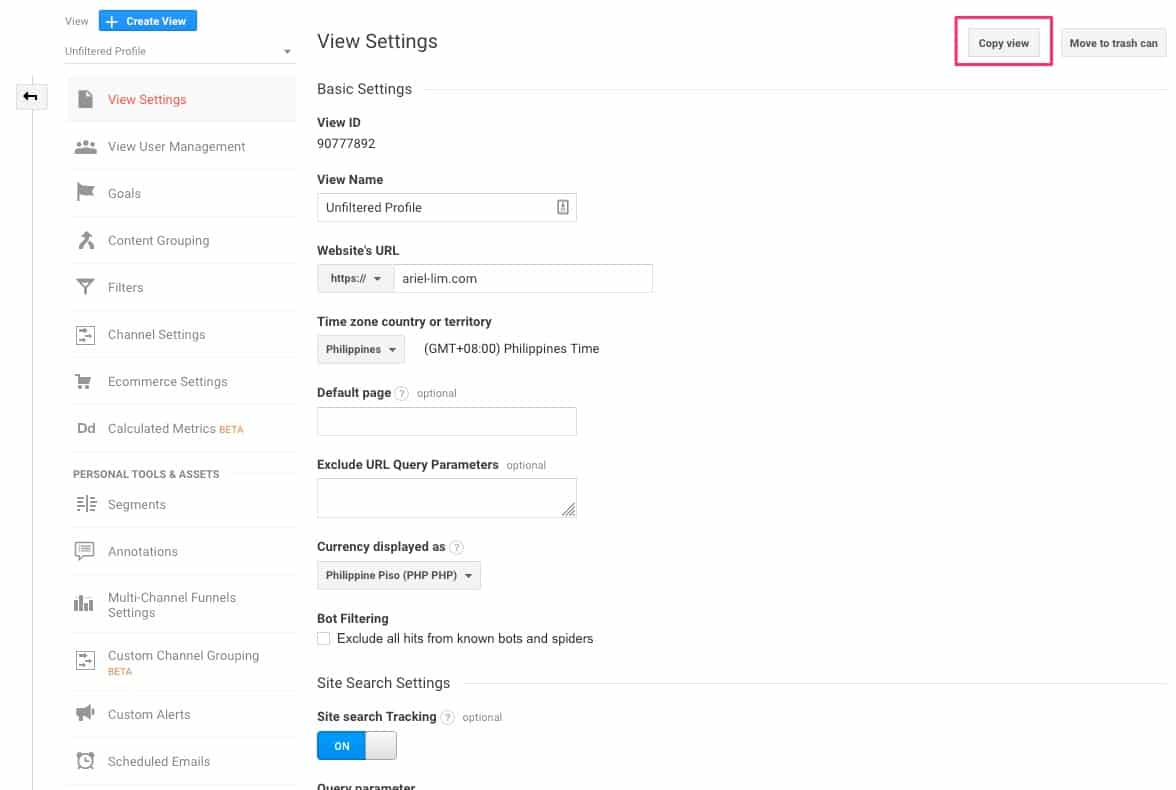
Step 2: Duplicate the View
Once you’re inside, you duplicate it by clicking on Copy View.
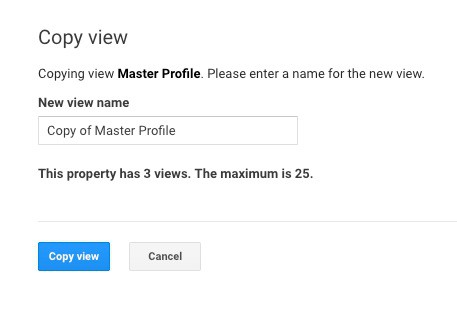
Step 3: Rename to Main Profile
You’ll be prompted to rename the view. Again, feel free to use any naming convention here. In my case, I use Master View so there’s no confusion. Then, click on Copy View.
Step 4: Filter out known bots
You’ll be taken back to the admin page again. Enter the settings again by clicking on View Settings of your newly created view.
Now, scroll a bit down and tick the box for Bot Filtering.
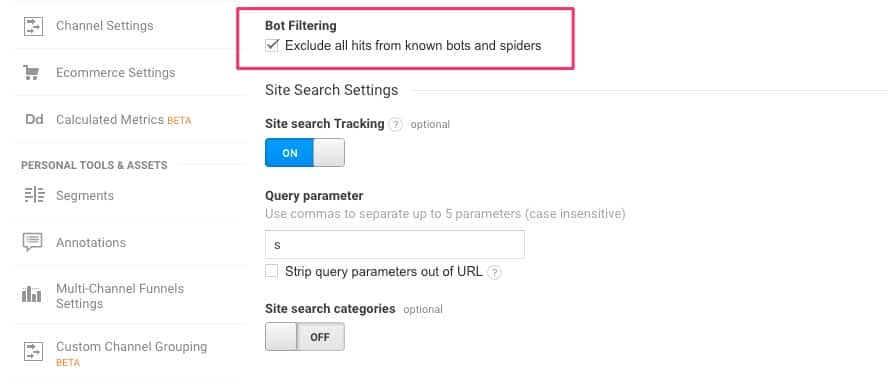
This is important so that you don’t get inflated views and inaccurate data.
Step 5: Save
Once you’re done, hit Save at the bottom of the page.
Step 6: Repeat for Test Profile/View
Then, repeat the same process and create another view for your Test View/Profile.
At the end of this, you should have three different views. You’ll use the main view for your reporting. If you want to apply certain filters and configurations, use the test view first. Once you are confident everything is working properly, you then apply that to the main view. Use the unfiltered view as a backup so that all traffic is still recorded.
2. Exclude Internal Traffic: Filter Out Internal Traffic
Now that you have three different views, as you get traffic on your website, what will happen is all data will be tracked/recorded in your Unfiltered View. But when you look at your Test or Main View, you should see a smaller number because it filters out known bots/crawlers and whatever filters you add to them.
Here’s an example comparing the Unfiltered View with the Master View:
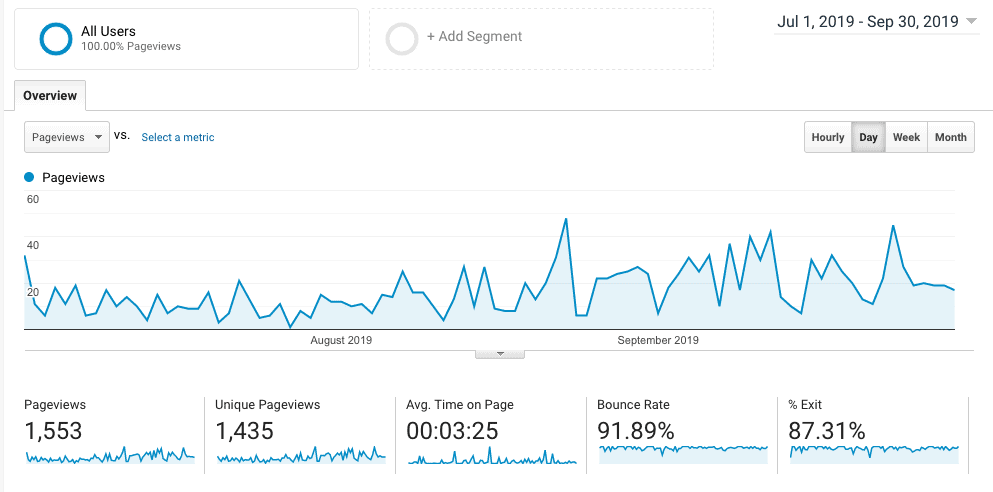
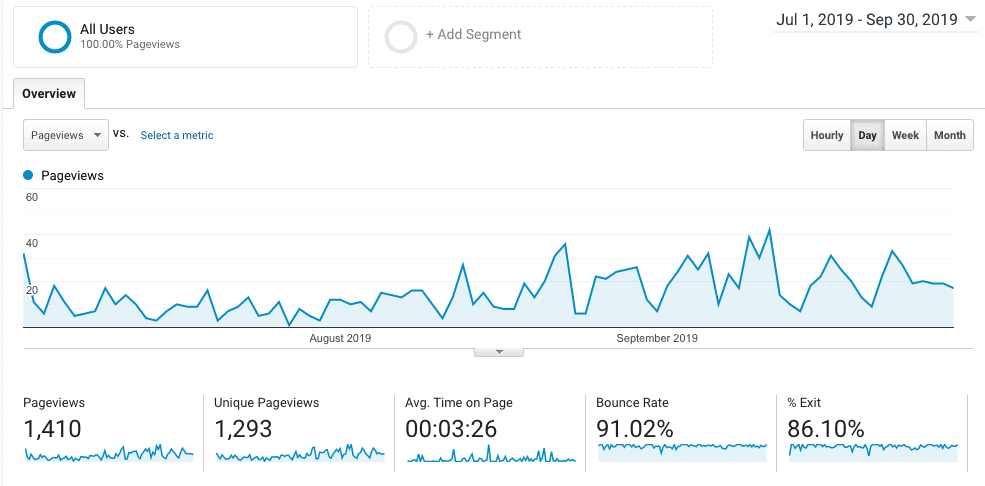
You’ll notice that the Unfiltered View has more page views than the Main View. I explained more about this in another post where I noticed stats from JetPack spiked, but my traffic in Google Analytics remained relatively low. This traffic most likely came from website crawlers.
And this is something you want to do because those inflated traffic might give you misleading insights later on.
Having said that, if you (or anyone from your company) visits your website, Google Analytics counts that towards your traffic. Do this enough, you would end up skewing your data.
The solution? Filter out your internal traffic.
Step 1: Go to the Test View
Head on over to the admin section again and select the Test View (or whatever you named it).

Step 2: Enter the Filters Settings
Next, click on Filters. You should see something like this.
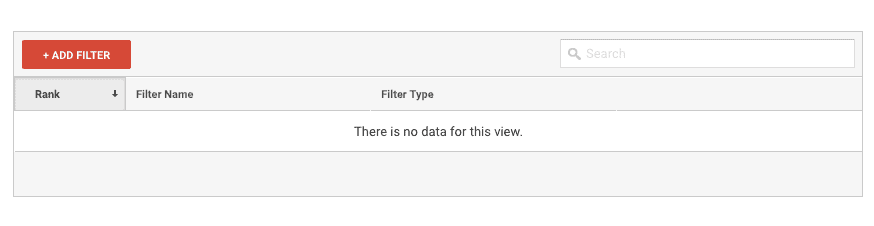
Note that if you (or someone else) have created filters before, they will show up here.
Step 3: Add an IP Exclude Filter
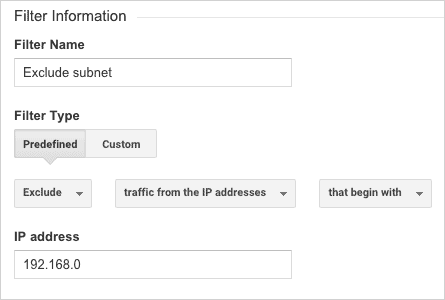
Click on the red button to add a new filter. Then, just follow what’s on this image:
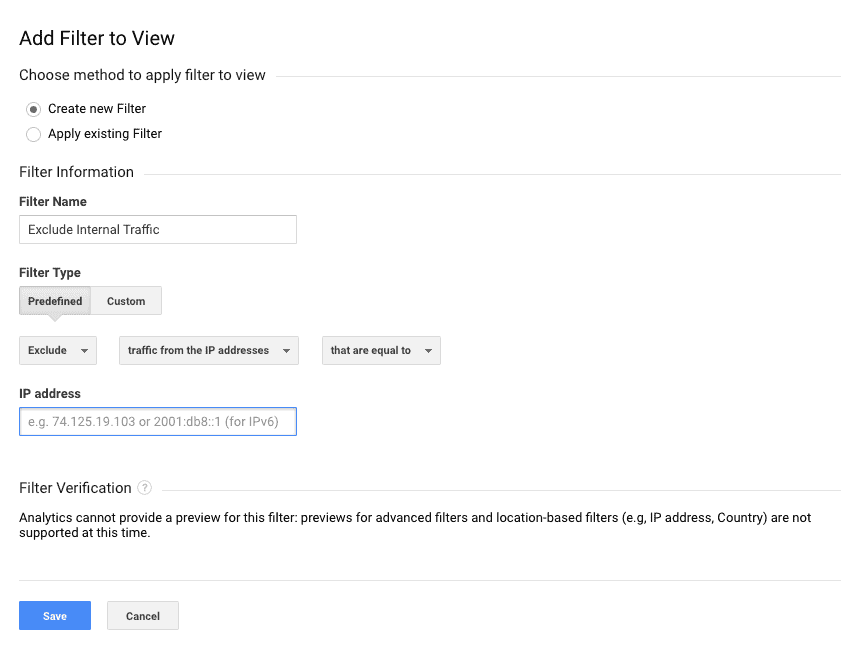
Get Your IP address
To get your IP address, you can type “what is my ip” in Google, or head on over here to get your IP address. Then, add that to the field above.
Important Notes About this IP Filter
This only works for static IP addresses. You may have a certain range of IP addresses if you’re working in the office or at home. You can ask your ISP about it. If that’s the case, you can configure the settings to look like this…
For more information about this, you can refer to Google Analytics Help Center.
Step 4: Test your data
After applying your filter, you have to make sure it works properly before you add it to your Main View. To do that, head to the reporting section of Google Analytics.
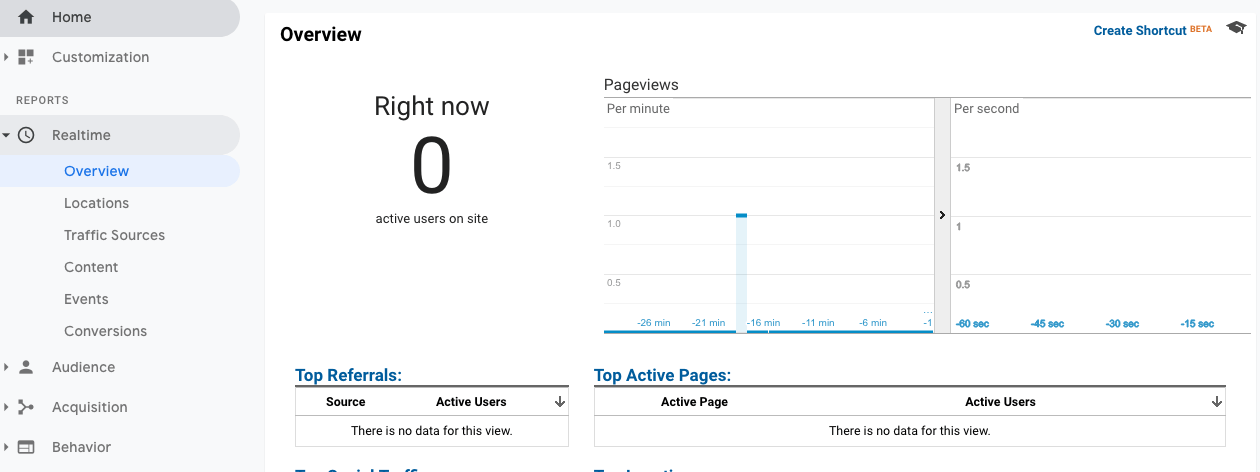
Then, open a new tab or window. Visit any page on your website.
If you don’t see any movements or hits on real-time reporting, you have configured this properly. Of course, if you have existing traffic, this might not be the case. What you can do to make sure you configured your filter properly is visit a page that is not often visited, say the terms and conditions page, or a privacy page. If it gets recorded, then you didn’t configure this filter properly.
Step 5: Apply the settings to your Main View
If, on the other hand, the filter is working properly, switch to your Main View and apply the filter.
Select theapply existing filter and all filters you created will be listed here.
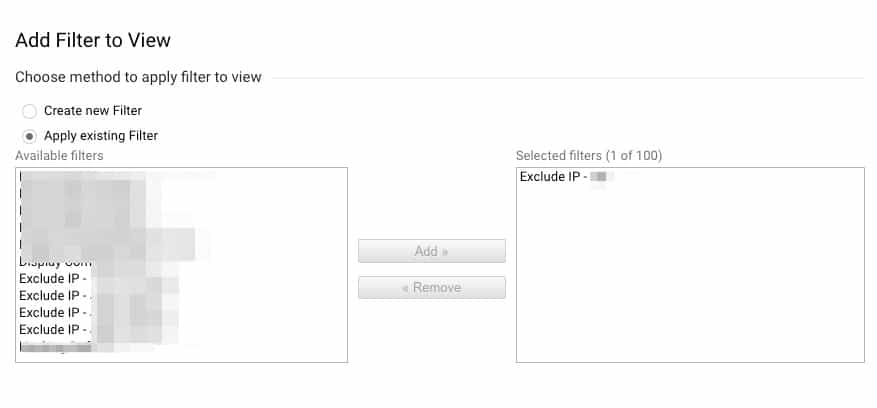
Select the filter you want to apply, click Add, then hit Save.
Noticed how I walked you through the process of applying configurations on your Test View first. Then, once you verified that the data is behaving properly, that’s the only time you apply it your Main View. Depending on the settings you apply, it might take a few minutes to verify the accuracy (like above), or it might take days. Follow this process always to ensure the quality of data in your Main View.
3. Add Goals to Track Important Business Metrics
Next, head on over to the Goals section. Again, try this out on your Test View first, before applying it to the Main View.
Creating goals in your Google Analytics account is the single, biggest action you can take to make your GA reporting relevant. Why? Because you have just linked it to important business metrics.
You would then be able to find out which pages are more important than others. Instead of simply looking at which pages/channels are driving you more traffic, you can proceed to the next level— which pages/channels are driving more conversions.
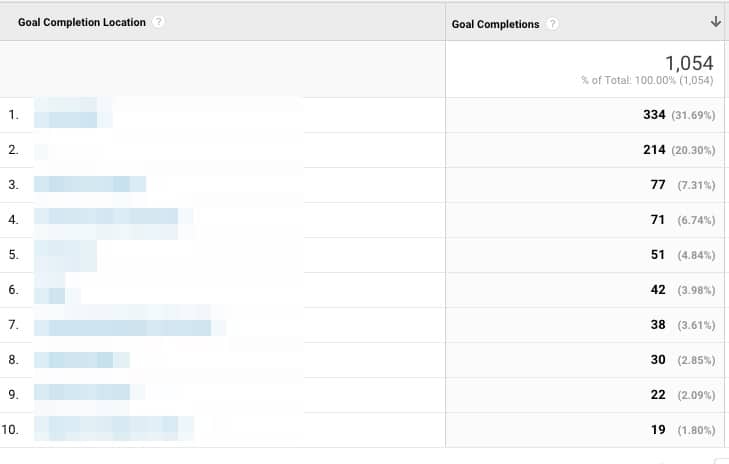
Now, you have something more meaningful. Now, you can analyze those pages and optimize them further.
4. Link Google Analytics to Google Search Console
Head back to the admin section of Google analytics then click on Property Settings. That would be the middle column.
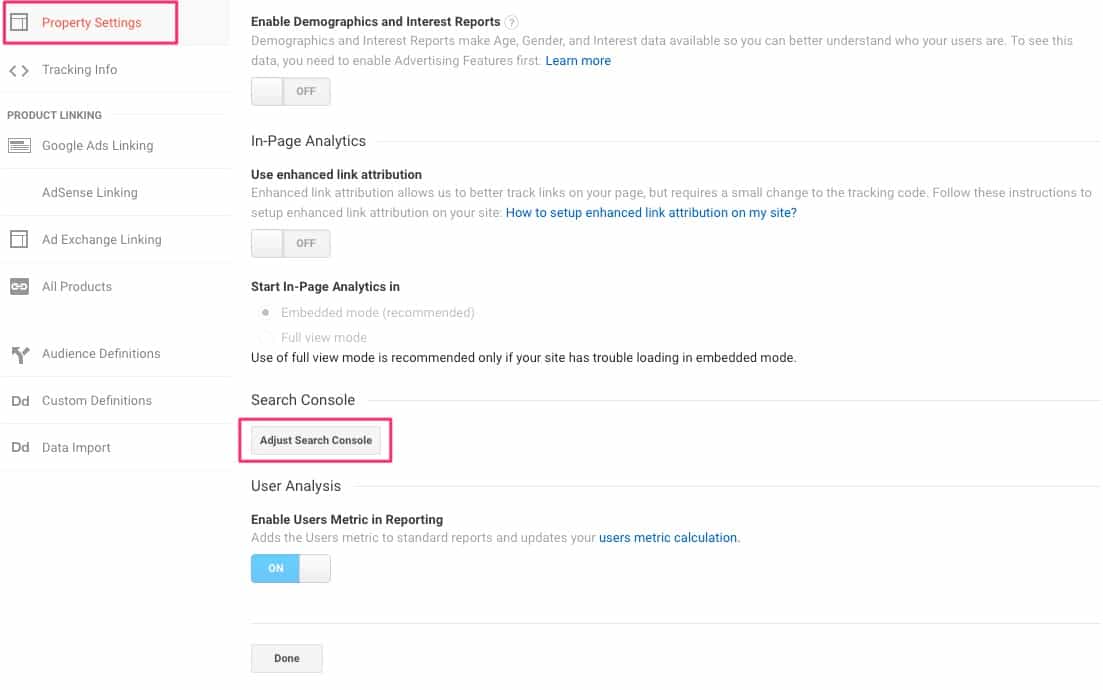
Scroll a bit further down and look for Search Console. Click on the button there and link your Google Search Console (GSC) account. If you aren’t familiar with GSC, I recommend reading more about it here. Think of it as a power-up to Google Analytics.
Here’s what you have to do.
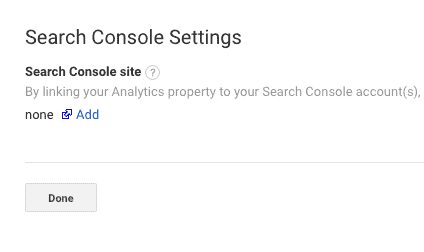
Step 1: Add Google Search Console
Once you’re inside the Property settings, click on the Adjust Search Console and you should see something like this. Click Add. This will open up a new window/tab and into your Google Search Console account.
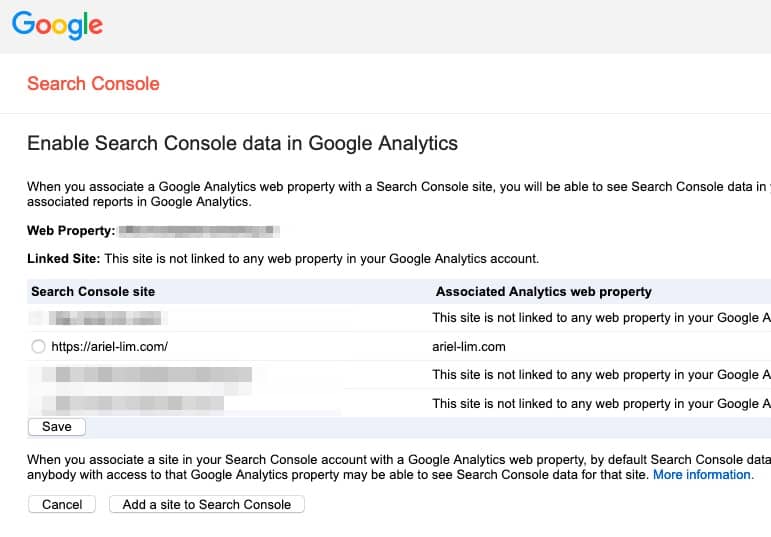
Step 2: Choose the correct account
If you have multiple accounts connected, you will see something like this. Just make sure you are connected it to the correct one. Hit save.
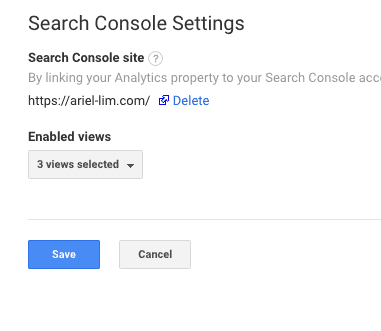
Step 3: Confirm settings
Go back to Google Analytics and check the settings again. It should say that it’s connected to your account just like the image below.
I’ll explain more about how you can use GSC with GA in some other post. But if you don’t know what it is or don’t have one, create one immediately.
5. [Special Mention] Filter Out Known Bots
I mentioned this in the first configuration because I included it in another step. But for the sake of being thorough, I’ll repeat this again here.
In your Test and Main Views, you should filter out known bots and spiders.

If you don’t, you might end up inflating your numbers. Unfortunately, by default, Google Analytics tracks the traffic coming from them. So, if you test your website speed using Google PageSpeed Insights or some other tools, each time you check your speed, it gets counted to your traffic.
Again, you don’t want that to happen.
Conclusion
Congratulations! You have now configured your Google Analytics properly. Your account is ready for more insightful analysis because the data that is coming in is clean and accurate.
I’ll write more about how you can analyze your data inside Google Analytics. For now, give yourself a pat in the back because starting today, you’ll be in a position to really learn about your users and how they behave on your website.
Of course, that’s just the first part of the battle. You have to maintain the quality of the data coming in — like when adding more filters and goals, you do that in the test view before applying the main view, etc.
You can then proceed with adding custom dimensions, add more goals, experiment with events, and perform A/B tests. You can also look into attribution reports and analyzing funnels.
There’s a lot of exciting things you can do and it all boils down to the work you did today—ensuring your GA account is setup properly and your data is accurate.
Have you configured your Google Analytics properly? If you have questions, or need help, please don’t hesitate to reach out.
