Controlling Your Costs Is a Wrong Mindset to Use

clean desktop

Control your costs. Manage your expenses. Reduce spending. Lower overhead

These are phrases, or variations of it, that everyone has heard before at one point in their corporate career.

However, if there’s one thing about expenses that people often don’t realize is that you can’t control or manage them. You can only cut them.

That might appear to be just a play on words, but the difference is huge.

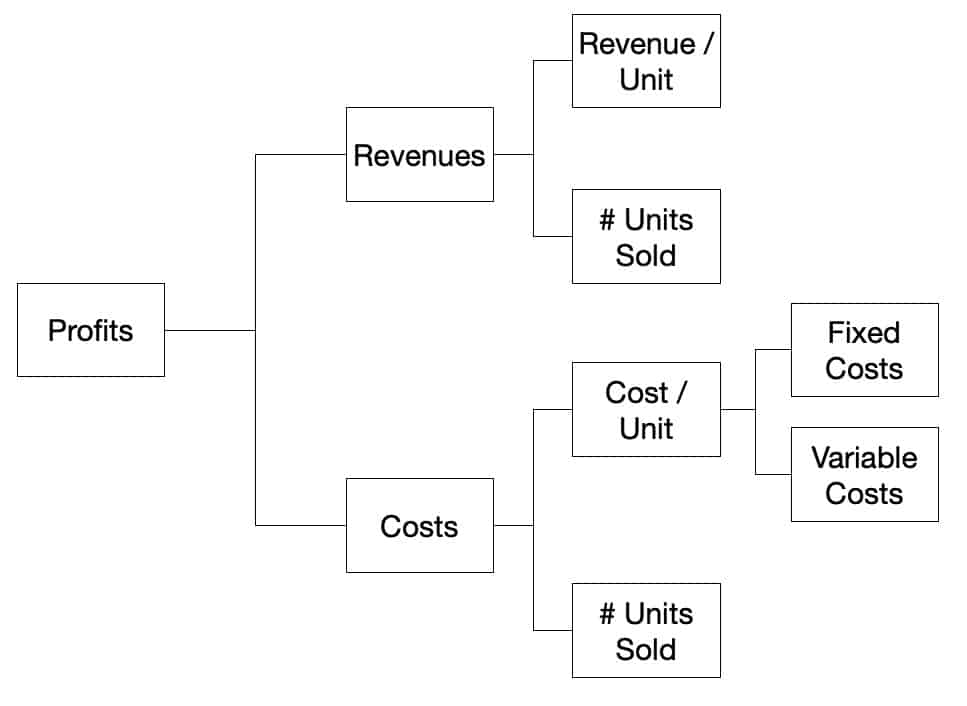
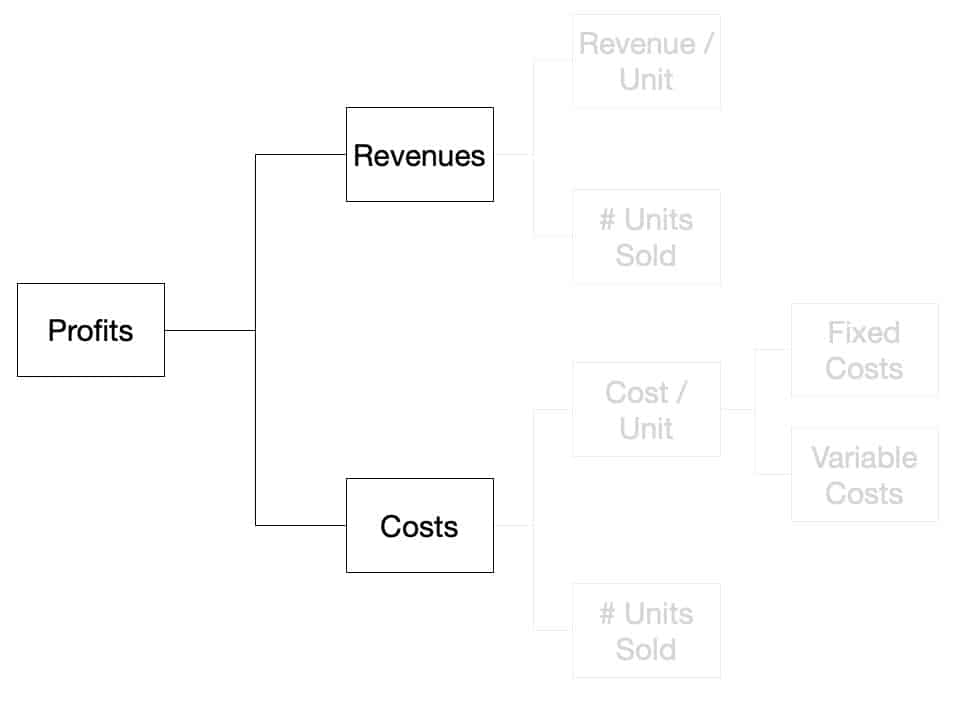
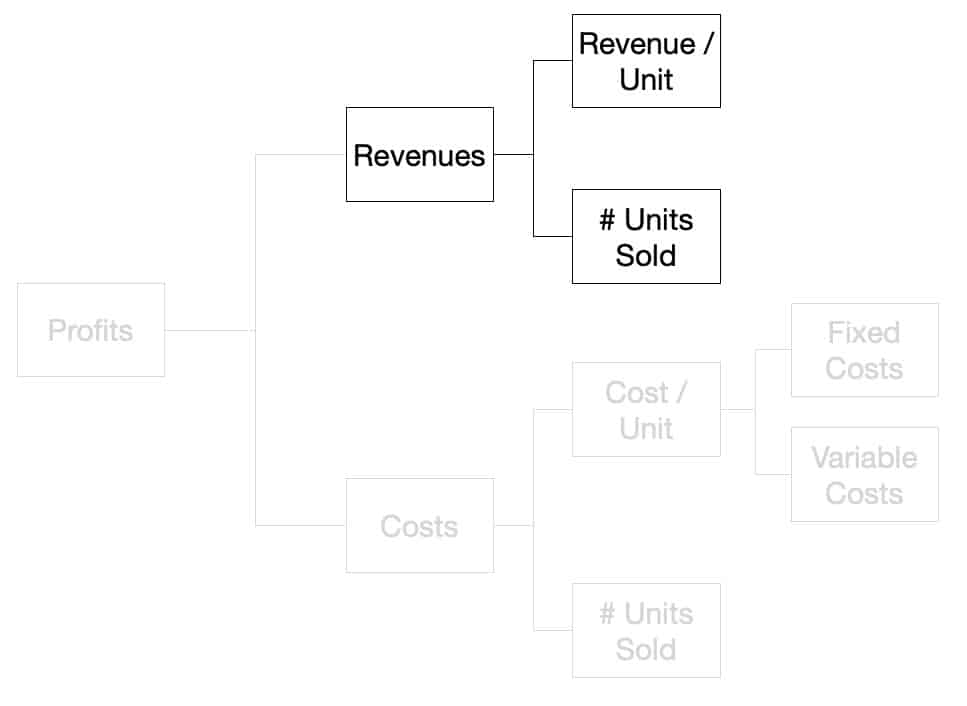
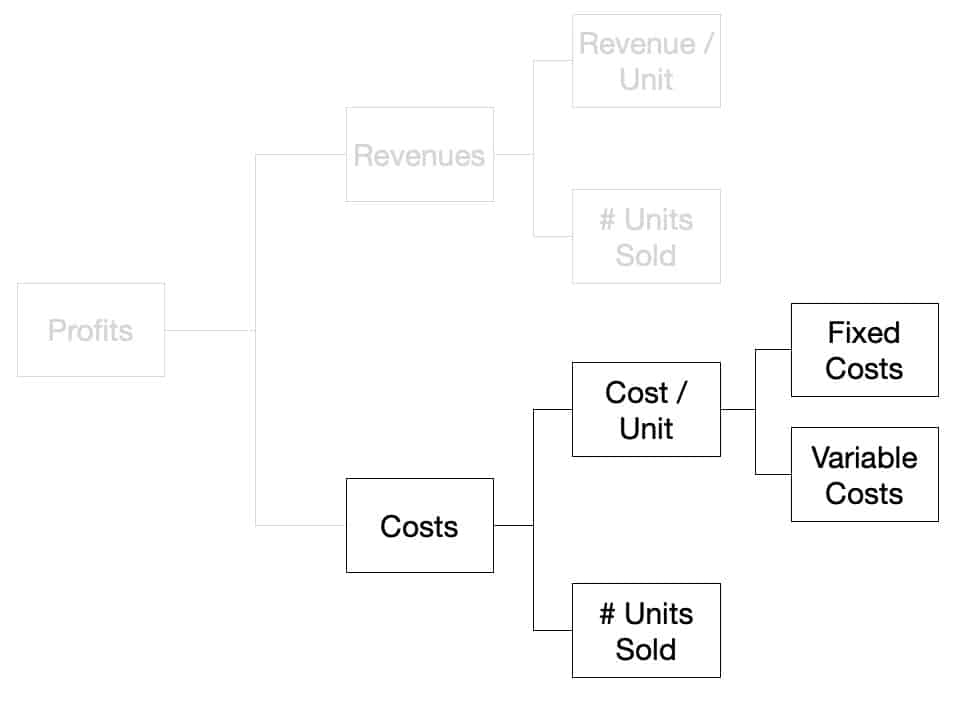
Costs (or expenses) are the second half of the profitability framework.

“The question should be: ‘Would the roof cave in if we stopped doing this work altogether?'” Drucker explained. “And if the answer is ‘probably not,’ one eliminates the operation. It is always amazing how many of the things we do will never be missed.”

The Danger of Managing Costs Instead of Cutting Costs

You might have probably guessed by now that I love Peter Drucker. He is arguably the most brilliant management consultant of our time. That’s also why he is revered as the father of modern management.

That aside, the approach to managing costs is finding ways to make things more efficient; while the approach to cutting costs is completely different.

Allow me to explain further.

Managing or controlling costs—becoming more efficient— doesn’t change the way you look at things. You accept the status quo and just improve on it, or at least find a way to improve the situation. This is why every time you do this exercise, it is very difficult to reduce the expenses.

On the other hand, to cut costs means you have to first “identify the activities that are productive, that should be strengthened, promoted and expanded,” said Drucker.

So, after identifying these value-adding activities, those that don’t add value, you cut them altogether. I included some guidelines on how to do that below.

This way of looking at cost is radically different than traditional methods of efficiency. Instead of simply looking for cheaper alternatives or putting pressure on suppliers to lower their prices, you re-evaluate everything.

Two Simple Examples in Businesses

Before that, here are two examples where the two perspectives differ:

Example 1: Monthly Events

Your organization conducts monthly recurring events. This can be anything from sales rallies to parties to general assemblies. If you wanted to only reduce your costs, most of the time, you look at alternative venues, cheaper food, or negotiate with the speaker, etc.

But if you are looking at cutting costs, you’d start looking at the results that these events bring in (if any). Or, if it’s even worth doing these events.

Example 2: Annual Conferences or Leadership Training

You frequently go or send people to conferences or training. If you want to manage your costs, you look for cheaper alternatives like different speakers, or maybe invite them to your office instead.

But if you look at cutting costs, you question the value of these conferences. Or figure out if they provide value at all.

Change before you have to.

Jack Welch

This shift in perspective is vital if you want change to really happen.

What’s important, Drucker said, is to make this a routine exercise — not something that happens only during downturns: “Businesses that actually succeed in cutting costs don’t wait until they have to cut costs.”

4 Key Questions to Ask and Answer

  1. Ask “what is our mission?”
  2. Ask “Is it still the right mission?”
  3. Ask “Is it still worth doing?”
  4. Ask “If we were not already doing this, would we now go into it?

1. What is Our Mission

Asking what your mission brings me back to my other article—what’s the purpose of your business?

How do you fit in the bigger picture? How is your business creating value in society?

The reason why this is so important is that without customers, your organization will cease to exist. If you are not able to create customers and keep them, you are not creating value.

One word of caution especially for tech-related businesses—don’t be blinded by the technology by itself. Technological innovation is not the same thing as value innovation.

2. Is It Still the Right Mission

The second question forces you to rethink the value you are delivering.

Put this in another way, are you delivering any value at all? Remember, the more technology is involved in your organization, the higher the tendency to believe that you are creating real value to your customers.

It might also be that you have delivered value before have become complacent to the ever-changing needs of the market. These are the Blockbusters, Kodaks, and Polaroids.

They have become leaders in their own markets and provided a lot of value. But over time, they think that their market leader status was unmovable.

3. Is It Still Worth Doing

This next question can mean two things: (1) it can refer to the mission, or (2) it can mean about this activity that you want to look at. Basically, you ask if this “thing” that you are doing worth it?

Going back to my example above, if the events were being conducted but aren’t really adding value, then why do it?

  • Because it’s tradition
  • We’ve always done it this way.

I can tell you now that these are terrible answers.

One specific example comes to mind every time I ask this question to myself. Back when I was working in one of the subsidiaries of a company with over 700+ employees, I noticed some reports that took a few hours a month to make weren’t being used. No one was actually reading them. They were redundant reports that were a small subset of a bigger report which was the one being used.

Obviously, this was a big waste of time for the people doing it. But, until I have pointed it out, they were doing it just because that’s the way it has always been.

4. If We Weren’t Already Doing This, Would We Now Go Into It

Finally, this question makes you rethink about things you want to do or change. Most of the time, we feel that what we are doing isn’t enough. By asking this question, you’d know if introducing this activity (usually accompanied by costs) is worth even trying.

“The overall answer” Drucker added, “…is almost never ‘This is fine as it stands; let’s keep on.’ But in some – indeed a good many – areas the answer is, ‘Yes, we would go into it again, but with some changes. We have learned a few things.’”

The definition of insanity is doing the same thing over and over again, but expecting different results.

Albert Einstein

Bonus Example

Earlier I shared two examples without going into the details of cutting costs. Now that you’ve understood the 4 questions you can ask, here’s another example where you can apply those questions: perks.

Perks can range from free meals to higher benefits, to sports programs. Anything under the sun that the company provides for its employees.

Oftentimes, these are argued to increase productivity and foster camaraderie, and as part of employee engagement. That’s why businesses have budgets for them.

The key point here is determining what value are they adding? Are they really making your people more productive and motivated? Do the perks attract more potential hires and retain current employees? Does it really help collaboration across different teams? The list goes on.

Conclusion

Managing costs is different from cutting costs.

If you’ve followed the works of Drucker, and I suggest you do especially if you are in a leadership position in your organization, he always puts things into a bigger perspective. It’s not just about making money. It’s not just about your company. It’s always the customer and how you are creating value for them.

These four questions allow you to evaluate which activities are value-adding and which are not. You “double-down” on these value-adding activities and cut the ones that don’t.

Force yourself to ask these questions over and over to make sure you are still doing the right things. Or put it in another way, to make sure that you are still delivering value to your customers.

The Only Formula You Need to Know to Run a Business

People Analyzing Data

Running a business is hard. Whether you’re a 1-man team or running a 10,000-organization, it can get pretty complicated. 

As an employee, you didn’t have to worry too much about other stuff other than your job. But as a business, you have to deal with them even if you don’t like it — financials, taxes, efficiency, tools and apps, and other decisions you just weren’t exposed to before. 

But did you know there is a very simple way to manage your entire business? This magic formula that I’m going to share will allow you to look at the health of your business objectively. 

Ready now? Here it is…

Profits equal revenues minus costs. 

Profits = Revenues – Costs

Preparatory Points

But first, I recommend reading the real purpose of businesses. Why? Because what I will share here is a result of delivering value to your customers. What that means is before we talk about sales or revenues, you have to understand where it comes from and why customers buy.

Without that understanding, it’s easy to get lost in the world of business and its complexities.

So, go on and take a few minutes to read the article. You can always go back to this one anyway. 

Done? Great. 

The Profitability Framework

Let me share a very simplified approach to business that will weed out all distractions. Let’s go back to our magic formula:

Profits = Revenues – Costs 

In consulting, this formula is called the profitability framework. It’s pretty self-explanatory but a very powerful tool when used correctly — which I’ll share later below. 

For now, let’s define each part first:

  • Profits are what’s left after you deduct all your expenses from the revenues you earned in any given period. 
  • Revenues are the sales from your customers. It’s the sum of all payments made to your at ay given period. 
  • Costs are the total expenses your business incurred during a period. This includes salaries, rent, etc. 

Simple, right? 

Now, let’s look at the profitability framework from another perspective. 

Expanded Profitability Framework

This is an expanded version of the profitability framework. Don’t worry if it looks a bit confusing. This will all make sense in a minute. 

Let’s break it down. 

Big picture thinking using the profitability framework

One of the key benefits of using the profitability framework is figuring out why something happened. Oftentimes, we are so busy running the business that you don’t take time to analyze what’s really going on and what’s causing it. This simple, magic formula will help you with that. 

Profitability Framework - Analysis

By looking at your profits and its components (revenues and costs), you would know how your business is doing. No complications. 

If it’s positive, then you’re doing okay. If it’s negative, then you’re not doing okay. 

At least at first glance. 

By just using these metrics, you would have an idea of what you should keep doing, and what changes you need to make. 

But let’s take it further.

We now know the what, but we don’t know the why

You can segment your data and compare it with other time frames. For example, you want to look at this month’s performance versus last month. Did profits this month went up or down? Is that good or not? Why did it change? 

(I also shared more about the three most common segmentation techniques you can use with the profitability framework below.)

Let’s take a look at the components that contribute to the revenues and costs. This will give you an answer to the why. 

Analyzing the revenue side for the formula

Revenues are made up of two factors: 

  1. Unit price
  2. Quantity sold
Profitability Framework - Revenue Side

Looking at this mathematically, revenues is the product of the unit price and the number of items sold.

Revenues = Unit Price x Quantity Sold

Let’s take a look at Apple. Let’s assume they only sell the iPhone 11 and only one model. They sell it for $699. Last month, they sold 500,000 pieces. 

That would make Apple’s total revenues last month at $349,500,000. 

(Again, I’m making this simple by using only one number. An advanced way to analyze this is to look at the unit price and quantity sold per channel, per item, and look at different time periods so you see trends.)

In reality, Apple has multiple product lines like Macs, iPads, and other accessories. Within each product line, they have different models/versions like in the iPhone example, they have the 64Gb/128Gb/256Gb models. Each of those models, you have different color offerings as well. 

Segmenting each part of the revenue formula gives you a better understanding of what’s really causing the what.

In our example, Apple sold $350m last month. Is that a good thing? 

You might say, “If revenues went up, that should always be a good thing right? I made more sales. How can that be a bad thing?”

Not so fast. 

The revenue side is just one part of the equation. You also have to understand the cost side. Allow me to explain. 

Analyzing the cost side for the formula

Profitability Framework - Cost Side

Costs are your total expenses for the same period. It’s made up of two factors as well: 

  1. Unit cost
  2. Quantity

Unit cost can also be broken down into fixed and variable costs. 

  • Fixed costs are incurred whether or not you made the sale. 
  • Variable costs are those expenses associated directly with the sale. 

Let me explain these two concepts quickly:

You sell fruit shakes at a kiosk stand at the mall. Your fixed costs would be rent and salaries because even if you don’t make a single sale, you still have to pay them. Then, your variable costs would be the cost of the ingredients you used. If you advertise, then that’s a fixed cost too. 

Again, when you apply some segmentation here, you would get a richer analysis. But that’s not what this article is about. 

Analyzing performance using the profitability framework

In our Apple example, we left a question about whether or not the increase in revenue to ~$350m by Apple is a good thing. 

The first thing to do is to look at the formula as a whole and ask these questions:

  • Did costs increase, decrease, or stayed the same?
  • Did profits went up, down, remained flat? 
  • What caused the changes? Which product line? Which version? Which model contributed the most? 

As you can see, using the profitability framework allows you to do all kinds of analysis. Knowing this formula by heart allows you to identify what is happening in your business.

Let’s take a look at another example below…

  • Profits declined by 20% this year. What caused it? Why did it happen? 
    • If your sales decreased by 20%, that’s the answer.
      • But which part of sales? 
        • Did you sell less this year than last year? 
        • Or did your selling price went down?
    • But what if your sales increased 10%, yet profits went down 20%?
      • If it increased, then your expenses would have skyrocketed by at least 30%.
        • Again, which part of expenses? 
        • Is it your fixed costs or your variable costs? 

Segmentation Analysis

Now, if you use this framework with segmentation or “slicing and dicing” of data, you will gain huge insights like I alluded earlier.

There are multiple ways to segment, but the most common are these:

  1. Time (daily, weekly, monthly, quarterly, yearly, etc.)
  2. Location (branches, regions, countries, etc.)
  3. Channels (walk-ins, phone, online, etc.)
  4. Product line (desktops, laptops, phones, accessories, etc.)
  5. Models/SKUs (64Gb, 128Gb, 256Gb, etc.)

Using the example in the previous section, your profits declined 20% and yet sales increased by 10%. After you segment the numbers further, you found out the Branch A’s sales remained steady. Branch B grew by 10%. 

Now you know what’s causing the sales increase. 

But that doesn’t solve what caused profits to decline. 

When you apply the same principle on the costs side, you found out that Branch B’s expenses grew by 40%. Now, you have a more informed decision that Branch A is performing well despite the steady sales, while Branch B, despite contributing to increased revenues, is actually the one causing the decline in profitability. 

Why Is This the Only Formula You Need to Master?

The single, biggest reason why this is the only formula you need to master is this: any organization will cease to exist if its profits are below zero for an extended period of time. 

By looking at this formula alone clears all distractions. 

Today, too many businesses are focused on shiny and exciting things that they often forget the basics. They are focused on getting investments, exits, IPOs, and all the other things you hear in the news. While nothing is wrong with those, you have to understand this in the original context of business — are you driving value to your customers?

Instead of spending your resources on those things, focus on this single formula and what it means for your business. It will give you an objective perspective of where you are right now and what you need to do.

At the end of the day, the only number that matters is profits. If you have profits as a business, it means you created value for your business and for your customers. 

If for a prolonged period of time, your profits are below zero, you will close up shop. You are not creating customers. That means you are not delivering value. 

If you are so down in the weeds monitoring the hundreds of metrics in your organization, yet fail to look at this very important number, it might be too late to pivot or to change your strategies. 

If you are in this situation right now (which I certainly hope not), it’s time to rethink how your business delivers value to your customers. Whether your profits are positive or negative, take time to compare it with historical data. Segment it. Know which segment of the business is helping you create more value and which ones aren’t. Decide whether to continue with this strategy or not.

One tool I recommend using is the buyer utility map. It helps you find opportunities across the buying experience cycle that you and your competitors might have overlooked.

Don’t get lost in the complexities of running a business. Focus on a the basics first.